they should teach this on sesame street instead
If it skews young then the amount of responses defunding the police is overestimated. If it skews old, then it's underestimated. Not sure if social programs skews the same. I'm going to guess no effect or only a slight underestimate.
This was a huge problem with polling in the Dem primary. There were tons of Iowa polls showing Biden up by like 15, then you saw in a pool of 800 respondents, 600 were 65+ and 150 were 45-65
Sorry, you are an idiot. So is hbotz. If all you want to do is argue in bad faith, I'll still make actual arguments and add insults, moron
Hey, you just pointed out why the poll is bad: opinion polls are supposed to be structured as yes/no questions like yours. Any other framing of questions confuses respondents. Look at some of the countries' ballots for Florida in 2000 and you'll find a ton of data on this being the case
No, it is worthless when they don't disclose age demographics. Gender should be displayed too. Especially on a question that has a massive generational divide. Hint: Biden won by a huge amount with black voters. He lost with black voters under 35 by a large (not as large as his over 35 win by a longshot) margin.
Nope. Michael Tracey routinely does this with polls. There's a reason I have him blocked on Twitter.
Not when they disclose demographics and age, which they always collect with these. Party registration matters too, though likely less
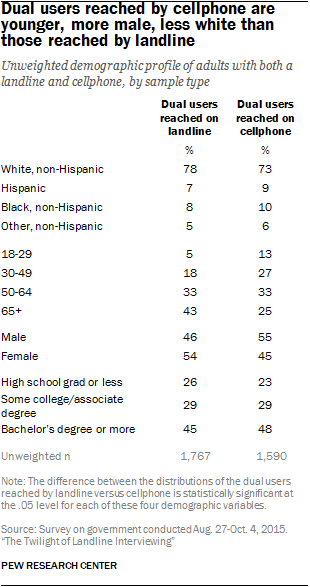
Lmao this is the problem: people under 65 don't have landlines. We went through this exact same thing like 8 months ago
And I was fucking right. Their poll is super skewed older.
Wonder why they don't break down race by age when they have both of those statistics ![]()
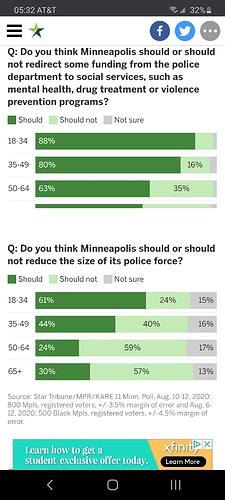
@hbotz and @theGreatWingdingi, how does it feel to be wrong over and over and over again? Turns out the first one only has slight age bias and the second one has massive age bias and they surveyed far more people 50+, with those below 50+ preferring reducing size of the police force and those 18-34 very clearly underrepresented and massively favoring reducing the police force.
Jesus fucking Christ it's not even close to their population by age. 50+ is nearly equal to 25-34 alone
![]()
@electrowizard buddy i never said the study was perfect. i readily agree that age bias due to imperfect randomization via phone distribution and badly worded survey questions skews the results (although for the second you have not commented on in which direction).
but we were trying to see if there was a difference between the sentiments of black and white people. if black and white people were affected the same way by the survey bias, then we could conclude their sentiments are very similar. however, there might be systemic age bias because of difference of landline distribution by age by race (e.g. old black people have more landlines than old white people so more old black people get surveyed). or it could be the other way around. i dont know.
however, thank you for contextualizing the absolute figures in light of the age bias. but we could go one step further and weight the numbers against the census distribution to get better figures. i think that is a better course of action than ding dong your study is wrong.
actually, its sufficient to just post the data stratified by age. its a valuable chart.
also, 61% of city youth supporting reducing the size of the police force is lower than i thought.
anyway i agree they ought to disclose demographics by age. if you think the pollsters have malicious intent and are artificially reducing black support via age bias, though, feel free to make such an accusation.
![]()
Nope
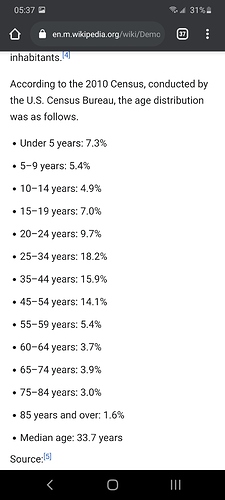
Yeah, I had an assumption and literally 5 seconds of Google told me my assumption was right
I didn't actually do the math, but you can clearly see how overrepresented old people are. They were 59% against for 50-64 and 57% against for 65+. 55+ makes up 17.6% of the population. I'll be generous and give 45-54 three quarters of 14.1% so like another 10.5% (this is probably a substantial overestimate). That makes 50+ 27.6%. So, we've got 50-65 as 19.6%, with 65+ at 8.5%.
The remainder of 45-54 to get 45-49 is then 3.9%. 35-44 is 15.9%, 25-34 is 18.2%, 20-24 is 9.7%. To get 18-19 I'll underestimate and give them 1/5 of the 7.0%, so 1.4%, leaving our 18-34 at 29.3%. Our 35-49 becomes 19.8%. So, 18-49 is then 49.1%
Now, we have to normalize then weight, but I'm on a phone so I'll do that later. I posted the census stats up thread. But you can tell looking at the differential of 37% yes over no for 18-34 which nearly a third of the population and the rest and it's very clear without the numbers this is extremely age skewed towards 50+, given their differentials were 35% no over yes for 19.6% of the population and 27% no over yes for 8.5%. their total population is less than 18-34, and their differentials were strictly less, with 65+ being a huge difference
Eh, that goes all the way up to 34. Minneapolis is kind of booming for tech jobs, so early 30s career professionals may slant that down. I wish the polls were like actual university run ones where they put all the data out so you can look at each specific age.
Ravenously hungry. Attempting to control the urge by observing it. Not judging it. Just watching it and listening to it.
 they should do a study comparing if children who experience a diversity curriculum end up more or less racist
Depends how you define racism


